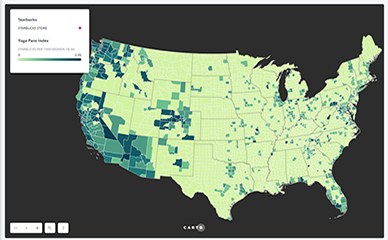
The map shows the number of Starbucks coffee shops per the number of college educated women ages 18 - 44. It was built using QGIS and published through Carto.

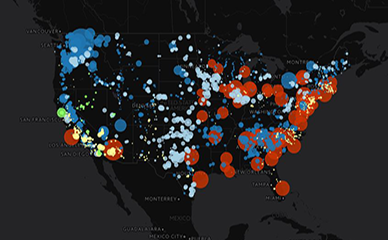
This map was built with custom JavaScript code drawing upon the Leaflet JavaScript Library, to show electrical energy generation from four different sources

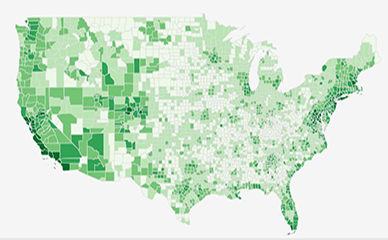
This map was built with custom JavaScript code drawing upon the Leaflet JavaScript Library

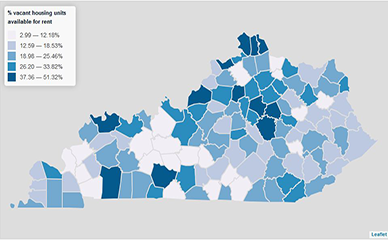
This map was built with custom JavaScript code drawing upon the Leaflet JavaScript Library, JQuery, and html forms to create an interactive map of vacant housing units in Kentucky

This map was built with custom JavaScript code drawing upon the Leaflet JavaScript Library, JQuery, Papa parse to parse the csv data, and Chroma.js to classify and color the choropleth. This map also features a time slider created with an html input element

This map was built with custom code from the Leaflet JavaScript Library, JQuery, the Mapzen geocoder, and Turf.js to create an interactive map of the voting districts in Athens-Clarke County